Category Archives: Weather

Hurricane Michael imagery

Some selected images from Hurricane Michael.  There are many more to add, so I’ll edit this post as I can.

Prior to Landfall

During Landfall

The Eye

https://twitter.com/Basehunters/status/1050088615550877698

https://twitter.com/Basehunters/status/1050721472564609026

Weakening after landfall, as seen on infrared satellite imagery

Damage Photos and Videos

Post-Analysis

Why don’t people evacuate?  Here’s a study from Louisiana: https://www.sciencedirect.com/science/article/pii/S2212420917301693#bib8


Florence & Manghkut imagery

Collecting some damage photos and videos for Hurricane Florence and Typhoon Manghkut.

Hurricane Florence

Animated rainfall accumulation map from the NY Times:  https://www.nytimes.com/interactive/2018/09/13/us/hurricane-florence-impact-damage-map.html

Typhoon Manghkut


Big hail near Dallas, April 11

A major hail event occurred in the north suburbs of Dallas on Monday, April 11.  Some media I thought worth saving are captured below.  [Reminders: more than anything, this is archive of images and links that I might use in future classes.  I may add more later, or delete some of these.  If you have any sources that you think complete or improve on this set, please do share.]

Let’s start with the geography of the event:

The Severe Thunderstorm Warning that included Wylie, focus of some of the videos below:


Videos

Slow-motion video of baseball or softball hail crashing into a pool:

Additional good ones:


Photos

I don’t know how big this person’s hand is, but does it really matter?

Additional good ones:

Meteorology

  • The focusing mechanism for convection: a surface low, frontal boundary and dryline.  The WPC’s surface analysis at 1800 UTC:
    namussfc2016041118
  • The full complement of upper air charts for 1200 UTC (11th) and 0000 UTC (12th) is available via the Storm Prediction Center’s archive.
  • A 9-h forecast sounding from the 4km NAM for 2100 UTC (model initialized at 1200 UTC).  Over 3000 J/kg of CAPE, no matter how you calculate it!
    nam4km_2016041112_009_32.91--96.14
  • And if model soundings aren’t your thing, the observed, pre-event FWD sounding at 1800 UTC.  But note that in this case, there’s a 2500 J/kg difference between surface-based and mixed-layer CAPE; the high surface dewpoint may be anomalous.
    FWD
  • A regional radar loop that honestly isn’t that breathtaking, but illustrates the isolated supercell nature of this hail producer.
    dfw_hail
  • At one point, about 2200 UTC, the storm had a textbook high-precipitation supercell look.  Upper left and color bar: reflectivity at the lowest elevation angle.  Lower left: storm-relative velocity.  Upper-right: VIL (the scale maxes out at 80 kg/m2, but I found a value of 121!!!).  Lower right: radar-estimated maximum hail size, with one pixel indicating 2.98-inch size.  Probably one too many significant figures there, but I digress.
    kfws_20160411_2202

Images and data from November 16

The rare November tornadoes in western Kansas provided some breathtaking photography and great meteorology.  As I’ve said before, one purpose of this “blog” is to keep some of that information together for posterity’s sake and for future classes.  If there’s anything you think would make a nice addition, send it on.

NWS survey photos and damage tracks:  http://www.weather.gov/ddc/TornadoOutbreak2015Nov16

Recap from US Tornadoes website, emphasizing the rarity of a November tornado event in the Plains

USA Today’s story has a superb collection of Twitter-linked photos from the day

Springtime in November” brief summary from Jeff Masters, including a couple of links

Story from the Hays Post, of people complaining about the lack of sirens even when they were being warned via text message (sighhhhh)

Sorry about the sounding diagrams below — they display correctly at full resolution, but they have a transparent background so the thumbnails look garbled.

DDC

DNR

500_151117_00

namussfc2015111621

My favorite media from April 9

In addition to just serving as a “blog,” I want to use this space to curate some of the images, videos, and links used in class for specific weather events.

The tornadoes of April 9 in Illinois (and elsewhere) are a good starting point.  Don’t hesitate to offer additions or corrections.  Each list like this will probably be updated at random times in the future.  Almost all these will be linked from source–I’ll provide acknowledgments for any that aren’t.

Videos

Photos

Data, other items, etc.


On scaffolding and learning outcomes

About 10 minutes into the first class meeting…..”I expect all of you to come to class prepared…”

Yawn.  *clicks back to Facebook tab*

Prepared to do what?  Listen to a lecture for an hour every day?  How do I need to prepare for that beyond making sure my laptop battery is fully charged?

Or perhaps, we should ask (and expect) our students to show up prepared for an active class period full of questions, problems, what-ifs, discussions, and ultimately some answers.  So how do we do that?  I try my best to follow Robert Talbert’s guide to creating learning objectives.  Seriously, that little blog post may be one of the best explications of how to design effective, active classrooms that’s ever been produced

To provide an example, I’ll return to the “difference between HP and LP supercells” outcomes I wrote about last fall.  In a course unit on supercell archetypes where we want students to “know the difference between LP and HP supercells,” we might come up with these:

“At the end of this section, students will be able to:

– state the physical differences between LP, classic, and HP supercells;

– recognize the different overall structure between the conceptual models of the three types;

– identify which types are more/less likely to produce tornadoes, strong “straight-line” winds, and large hail;

– describe how environmental wind shear plays a role in modulating supercell type;

– describe how atmospheric water vapor and/or cloud base height play a role in modulating supercell type;

– sketch and label archetypal models of LP, classic, and HP supercells, including cloud and precipitation extent, updraft location relative to precipitation, surface outflows, and the most likely location of a tornado;

– differentiate between supercell modes using radar data; and

– differentiate between supercell modes in photographs and/or videos.”

Wow.  That’s a lot to accomplish…probably multiple classes!  I think these are listed roughly in order of increasing difficulty–which is the point–and it would be very easy for me to just sit back and put together 80 or 90 slides that cover everything, and then test students on what I think is important.  But I’d rather have them do some Preparation H (homework!) and come to class armed with some basic vocabulary and knowledge.  That way, we can get further down the list and spend our class time really diving into and interpreting the radar data, pretty pictures, and complex videos.

So here’s my approach.  Before the class period(s) on supercell types, students are expected to be able to perform the first three, maybe four, tasks on that list.  Yes, I expect them do be able to do these things before coming to class.  The activities for this unit would probably involve reading (Ahrens Extreme Weather and Climate pp. 311-5), looking at additional material (this nice and quick summary by Zach Roberts), and answering short questions online before class (the Just-in-Time method; my example questions for both days of this unit are at the bottom of the post).  If students have done the requested assignment, and spent time digesting it and trying to understand it, they should be able to answer these questions easily and will be well prepared for two productive and fun class periods.

Class time would begin with a follow-up on anything that students identify as still unclear, and a review of their answers to the pre-class questions.  This typically only requires 10-15 minutes; after that, we move on.  For the students who didn’t answer the questions, and didn’t show up prepared, they are going to be seriously lost for the rest of class.  It is imperative that students realize their success in class depends on coming to class prepared.

It’s then on me to select the right kind of in-class activities to achieve the last 4-5 objectives in the list.  Just a few ideas:

  • I might draw three different vertical shear profiles on the board, and ask students to discuss and then draw in what the Cb would look like — barely tilted in weak shear, somewhat tilted in moderate shear, and very tilted in strong shear.
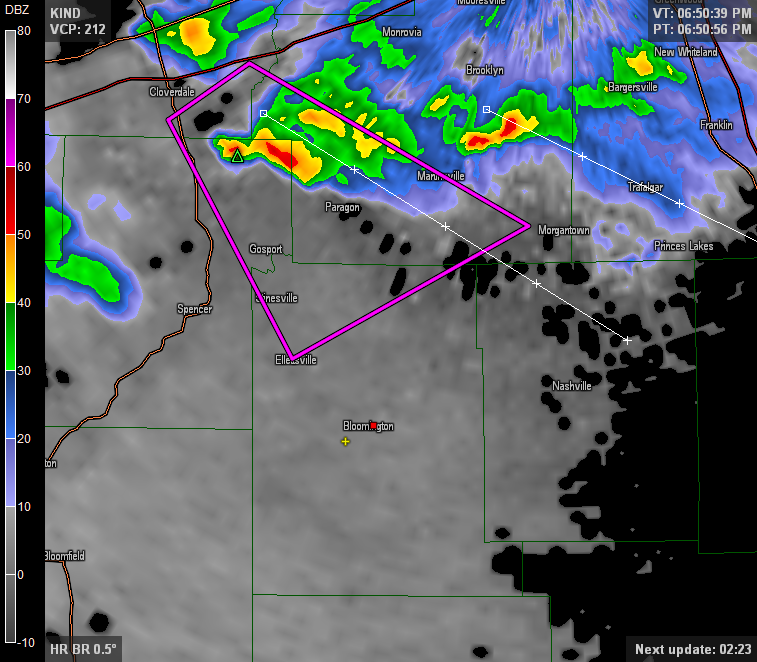
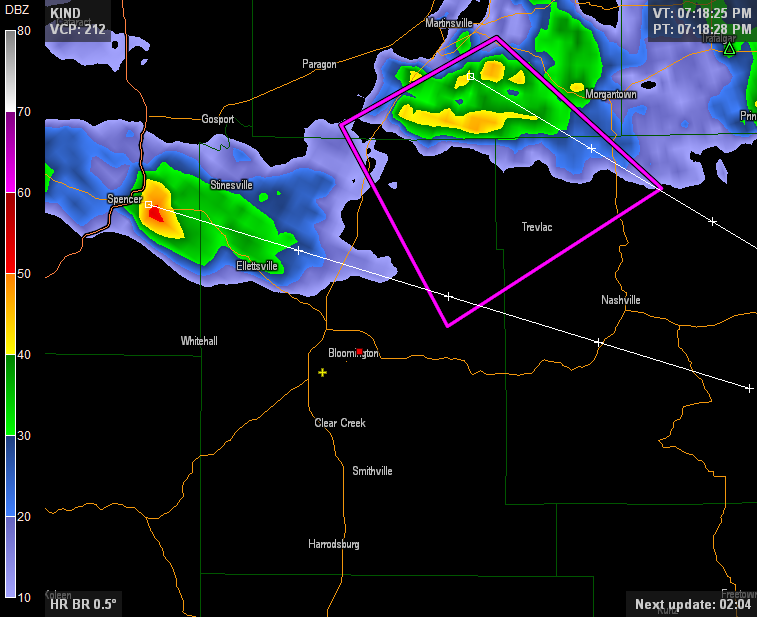
  • Provide a printed color copy of reflectivity and velocity data for a classic supercell, to let students draw on and place the mesocyclone relative to the precipitation.  (And then identify and label the “hook echo.”)
  • Giving the customary supecell schematic with most (or all) of the labels missing, and ask students to label pertinent features.
  • Display Figure 7 from Rasmussen and Straka 1998, and ask students to identify which bar graphs correspond to LP, CL, or HP storms.
  • Or others, depending on how students respond to the pre-class questions.

This set of learning outcomes, arranged in approximate order of difficulty, is precisely what I would give students as a “study guide” for these class meetings.  Exams would include questions that test a range of these outcomes.  The ‘A’ students will successfully use photos and videos and radar, the most complex tasks we do; the ‘B’ students will be able to relate supercell types to environment and to label their models; the ‘C’ students may only know the LP/CL/HP differences and the tornado risk from each.

I’ll close with Talbert’s last sentence, which is a superb summary of this process:  “This is far from a perfect system, but it’s a reliable way to align learning objectives with the actions you want students to perform and the means you want to use to assess them, and it gives students a key ingredient for self-regulated learning: A clear set of criteria that will tell them what they need to know and how to measure whether or not they know it.”

– – – – –

Students submit answers to these questions online before the first day:

1. The textbook omits large hail from the list of hazards for one of the three supercell types.  Which type is less likely to produce large hail?

2. Name two differences you see between the HP and LP photographs in the online reading.

3. Radars can be helpful in determining supercell type (LP/classic/HP).  Why do you think that’s the case?

4. Name one thing about either reading that was unclear, confusing, or that you would like clarification on.

Before the second day:

1. The author of this video has declared this storm to be an LP supercell.  Do you agree?  Why?  How would you compare it to the photo and schematic you’ve already seen?

https://www.youtube.com/watch?v=BF8XManeSn0

2. Name one thing that was unclear about yesterday’s discussion that is still unclear, confusing, or that you would like more clarification on.

Turbulence and mixing at the power plant

Hot, moist exhaust from the campus power plant stacks mixed with frigid air this morning to produce some great turbulent flow and even some “mixing clouds.”  (Video is 90 seconds; I zoom in a bit at 60.)  My favorite part: notice that the interior of each plume remains somewhat clear–that’s the part of the “updraft” that entrains ambient air last, so in this case, it stays clear the longest.  Neat!

As for the clouds, this is the same process that causes airplane contrails, and your breath to appear in winter.  For more information, here’s the AMS Glossary definition of mixing clouds and here’s a quick explanation using temperature and vapor pressure from the Hong Kong Observatory.

I’ll look for a couple of good explanations & links related to entrainment and update this when I have the chance.

Sirens, Tornado Warnings, and Messaging

TL;DR version: Sirens go off if any part of the county is put under a warning, even if the risk is nowhere near your part of the county. YOU may not even be at risk. 

Last night in Bloomington was a textbook case of how complicated the “weather warning business” really is. Here’s a rundown of the most important issues.

Warnings. Since 2007, the National Weather Service has issued tornado warnings not by county but by risk area–it’s called a “polygon” because, well, it looks like one:

The area in that pink box is the area the experts at NWS in Indianapolis placed under a tornado warning, for the storm that’s also in the box (this is a pretty standard weather radar image that you’d see on tv, with red indicating heavy rain and hail and the small green triangle also an indicator of hail). This image is of the first tornado warning from last night. Notice how this box does not include any part of downtown Bloomington, or the heart of the IU campus (red dot), or even my house (yellow plus).  This polygon is the box I use to make my own safety decisions.  Any weather app that’s worth its salt will plot these polygons. Look at that image again. For the entire time the warning was in effect, NWS predicted that the storm would remain in that box (and it did). There is no reason to panic or to take shelter if you’re not in the path of the storm–which is what the box shows for this warning.

As the NWS office in Birmingham, Alabama says“It is our goal that only those inside the polygon should take action.”

Sirens.  Many siren systems in the US are still sounded by county. That means that no matter how small the sliver of your county, if any part of the county is placed under a tornado warning, the sirens will go off everywhere. This is true in Monroe County–it happened twice last night. So the takeaway messages are:

  1. Sirens do NOT always imply that your location is in danger. They imply that some PART of your county is in danger. The storm may stay 10, 20, or even 30 miles away from you.
  2. Sirens are sounded by a county employee (at least here). No one on the IU campus, to my knowledge, has any control over the sirens. None.

By the way, the sirens went off twice in Bloomington last night. The second time was for a storm that was forecast to clip the northeastern part of Monroe County.  Here’s the radar and tornado warning polygon for the second one:

Again, no risk for Bloomington.  Zero, zilch, nada.

Confusion. Last night got a little squirrely because IU sent messages telling everyone to seek shelter for the first warning, but for the second warning, some messages told people that campus was not being impacted. For once, the polygon seemed to matter! This should happen in every event. This should become the standard and not the exception. (For the record, it’s the first time in my 3 years of living here that I’ve seen this happen.)

Here’s what we absolutely cannot do. Send this email:

And then send this tweet:


This is a messaging and safety nightmare.
Why would I “take cover” for something that “does not impact” me? Which one of these messages should people listen to, if either one? Just as mixed messages from faculty to students lead to protests and grade changes, mixed weather information leads to fatalities. This storm was of absolutely no risk to Bloomington, but the message implied it was. Until it wasn’t.

My personal view is that we all have to make our own safety decisions. I realize that if you live in a residence hall, or work at a big-box store, you may be required to follow someone else’s instructions. Based on the above, I’m honestly not sure what those instructions would have been. With that in mind, I’ve always believed and said that you and you alone are responsible for your safety. Make the decisions you need to make and do what you have to do, whatever that may be. That goes both for both seeking shelter and coming out from shelter so you can get on with your life.

Why meteorologists shouldn’t “teach to the middle”

Once every decade, we take the temperatures of the last 30 years, average them together, and refer to this as the “normal” temperatures for a location.  For example, when you see on the nightly weather report that the “normal high for today is 84 degrees,” that’s simply the average of all the highs for that day from 1981 to 2010.

The number 84 is an average.  Very few, if any, days in the record will actually have had a high temperature of exactly 84!

The same goes for our students.  In any given class, the number of “average” students, perfectly in the middle of the distribution, will be quite small.[Footnote 1]  My argument is this: if we teach to the middle, we alienate and bore our upper tier of students (who are our future colleagues) and at the same time work over the heads of weaker ones who may need the most help.  We likely reach those few students who are truly in the middle of the distribution, but overall to me this is a lose-win-lose situation.  Losing two battles every day is not how I want to spend my career.  Furthermore, the standard we “set by teaching to the middle is a standard of mediocrity.”  It’s okay to be average, kids.  Everyone gets a ribbon.

What, then, is the answer?  Is there one?  How can we possibly differentiate learning when faced with 100 students, or even 40 or 50?  Facilitating a classroom that promotes learning already requires lots of work, and most academics I know don’t believe they have any additional time to devote to it.  Here are some rough ideas, certainly a non-exhaustive list but maybe a starting point at least.

1. Variety in course assignments.  Some of our students will be math stars, while others are incredible artists who struggle mightily with college algebra.  Offering different types of work — calculations, concept mapping, figure interpretation, opinion essays, etc. — allows all students to take part.  I like to believe everyone is good at something.

2. Variety in in-class activities.  I pray that the days of lecturing for an hour a day three days a week are dying (an albeit gruesomely slow death, but still dying).  And reading text on slides as they appear on the screen doesn’t teach to anyone, let alone the middle.  In-class activities and discussions can be like #1 above and also varied in level: a mixture of easy concepts, medium concepts, and the occasional mind-bender sets up a class that everyone can get something out of.  Structured group and team-based activities, discussions, or even quizzes (yes, group quizzes!) help also.

3. Structure in assignments and activities.  “You need structure. And discipline!”  In a room of professionals, we could get away with the activity ‘hey let’s pull up today’s 500-mb map and just talk about it for awhile.’  However, this will likely fall flat in a room of mixed majors or gen-ed students.  At least when I’ve tried it, it has.  Even off-the-cuff activities need structure and scaffolding (take small steps: first let’s find the ridges and troughs, and the vorticity, and the temperature advection, and then ask where are the likely surface features, etc.).

The bottom line here is that we have to find ways to involve everyone (or, realistically, as many people as possible) in the room in the learning process.  If “teach to the ____” is just code for “at what level do I pitch my lectures?” the problem goes much deeper.  To me, the room is more about what learning will be taking place, rather than what teaching will be taking place.

We’d be hard-pressed to find a string of perfectly “average” weather days, instead finding runs of hot and cold which both have their own fun and own beauty.  And each of our classes is made up of much more than a blob of “average” students who are the only ones to deserve our attention.  A classroom includes a spectrum of abilities, and everyone learn something when courses are thoughtfully organized for more than just what we believe the “average” student is capable of doing.

Footnote 1:  Some readers will want to start talking about normal distributions at this point.  I ask, are the students that are at +1σ and -1σ at the same skill level?  What’s really the “average” group, then?  +0.5σ to -0.5σ?  That’s now less than 50% of your class.  The bounds get smaller and smaller…